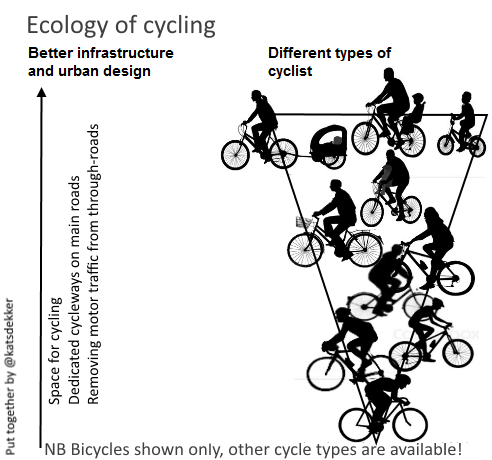
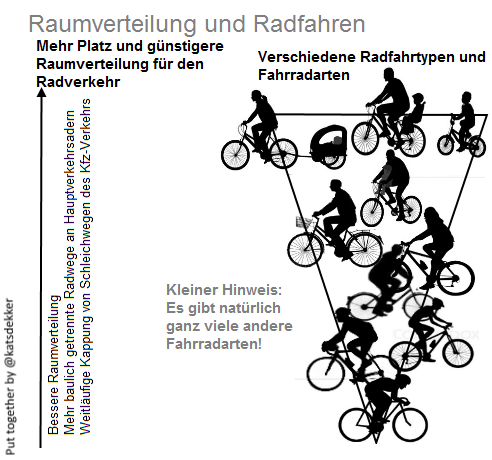
A quick note from me this week, proclaiming that “you get the cyclist who you have designed for”. A depiction of that thought process came out of my head this week (below) … let me know if it’s replicating (visual) thoughts that you have seen elsewhere. I’d be interested to hear. Please share it onwards. It’s important I believe, that we talk about cycling in context and that we talk about it creatively too. That should mean that we ought to ‘create’, shift and shape the context and creatively describe and explain the context too.
There are indicators (type of cyclist, type of cycling, type of cycles…) that correlate with cycle modal share and available infrastructure.
Observations that could be made about the ‘ecology of cycling’ are these:
The more predominant the upright/vertical position of the cyclist is in the prevailing cycling constituency, the stronger is a cycling ‘culture’ and its supportive infrastructure and environment (surrounding and enveloping each cyclist protectively). A wider age range can be seen in places with better cycleways and cycle networks. The more the journey is supporting average speed (rather than the racing between junctions, followed by waiting, waiting…), the more consistent and comfortable is the overall cycling experience. In places where cycling is enabled through complete networks and made accessible and convenient to a wider public, a civilising (and normalising) influence on cycling practice is in progress.
I could go on, but you know all that, so I will stop here. As always, please leave your thoughts below.


Are there actually any Dutch bikes in the picture? 🙂
Are racing bikes and vehicular cyclists the raptors of this ecology, so Dutch bikes are baa lambs?
LikeLike
The Raptors in this ecology are the cars/trucks. Vehicular cyclists/racing bikes are the fast hares & Dutch/upright bikes are the young/old, in this imperfect analogy. Anti-infrastructure attitudes aside, cyclists are not competing with or crowding out other cyclists. The racing bikes still exist, maybe even in same absolute numbers, in bike-friendly towns/cities. The (bike) friendliness allows for the diversity not the other way around.
An aside, we never talk about runners/joggers intimidating mere pedestrians on sidewalks/parks. Even where “Running Groups” get together with large fast groups running together.
LikeLiked by 1 person
Approximately middle left looks like a non-electric mamachari – that’ll do http://www.cyclelicio.us/2010/mamachari-blog/
Otherwise I think roadies are more like remora to motor vehicle sharks and Dutch bikes like reef fish, but the UK reefs are bleached. Or something 🙂
On the OP, you can see the differentiation of the whole diagram represented in SW London – on a sunny day riders in the parks are mostly like the top half of the picture, whereas riders on the roads with motor traffic are mostly like the bottom half. The contrast is quite stark. The families riding in the parks mostly drove there. The challenge is to get them to cycle there (and elsewhere) and as the diagram axis indicates, that comes with better infrastructure and urban design.
One further point for now, about the waiting times. I presume the article is primarily thinking of waiting times “orthogonal” to motor traffic flows. It’s actually become as bad travelling *with* motor flows. I’ve rarely cycled into Inner London since TfL went traffic signal crazy. As a “forced vehicular” rider the stops every few tens of metres have simply become too boring. I’d rather get the train/tube/walk. Not that Outer London or Surrey urban roads are immune. The Kingston and Epsom gyratories are nightmares of stop-start because of the signal phasing. Not so bad if you’re just having to press the throttle in your car, but exhausting to cycle. This is yet another thing that has to be sorted to get more people to cycle. File under “convenient”.
LikeLike
Kats, could I use your graphic in an internal piece I am writing for my company please. I’m doing a bit on cycle infra, your graphic will help make my point for me. Very happy to explain further, ideally via a PM
LikeLike
Great point well illustrated. Anything that helps us stop the arguments about behaviour and focus us on design is really helpful.
Maybe this also works for behaviour: “you get the behaviour you design for”. Difficult to put into a graphic format….
LikeLike
I like the idea of the graphic and your words in the comments say the cycling types are additive, not excluding one another. The graphic uses two dimensions to display a one dimensional idea (that more cycling infrastructure can accommodate more types of cyclists). The graphic inadvertently implies upright families push out racers, etc. You could instead show a growing cone of diverse users that continues to include racers etc as it moves up the chart and gains more upright cyclists.
LikeLiked by 1 person
[…] Source: Ecology of cycling – the cyclist you design – katsdekker […]
LikeLike
This way of depicting the effects of infrastructure on cycling is quite powerful.
It would be fascinating to tally cycling infrastructure users by type, and plot them on a 2d graph like this. Cycling level of service/safety/protection could be the independent axis, and the dependent axis could scatter vehicles by type arranged by level of ability/disability. We could see how protected space actually enables hand cyclists, mobility scooters, and Christiania tricycles.
LikeLike
Excellent analogy – speaking as one who cycles 100s of miles both here and in Holland – age 62 and with a variety of bikes.
Brian McPherson – I don;t know when you last cycled in Holland – but the only ones I ever see on road bikes and with helmets and speeding along – of any age – is when they are out training. The rest of the time – and I have in the last year virtually cycled the length and breadth of the country – people of all ages and all types are cycling mainly upright – and even more upright as they have these extra things attached to the handle bars for more comfort. Mind you some of them can also comfortably ‘hare’ past me on these ‘Pashley’ type bikes!
LikeLike
This is superb, and I just want to thank you for writing it.
I run a Dutch bike shop in London called Flying Dutchman Bikes. We’re based in Camden, and we’re hoping to see more upright riders as the city moves away from the motor-centric traffic culture that currently dominates.
LikeLike
Anyone done a Clade diagram of bicycle evolution ? airandspace.si.edu/exhibitions/wr…
LikeLike
http://airandspace.si.edu/exhibitions/wright-brothers/online/who/1893/shop.cfm
LikeLike
Great idea graphic, but a little one dimensional for me. I know plenty of cyclists who ride a variety of bikes, so they are at several places on the ‘type continuum’. And In Holland I believe that the club cyclists use the infrastructure too, alongside the uprights. And isn’t ecology a measurable, data based science. I think that the graphic makes sense if we’re considering power structures and relationships in all of their myriad forms. In that context, we get the infrastructure we deserve?
LikeLike
Reblogged this on CycleBath and commented:
If you build it right children will come and cycle on it.
LikeLike
[…] Figure 2 – Find ways to present information to decision makers, example, from https://katsdekker.wordpress.com/2016/01/09/ecology-of-cycling-the-cyclist-you-design/ […]
LikeLike